Rust’s 2026 Async Revolution: How Colored Functions Finally Died (And Why Go Developers Should Pay Attention)

The Async Ergonomics Breakthrough That Actually Matters

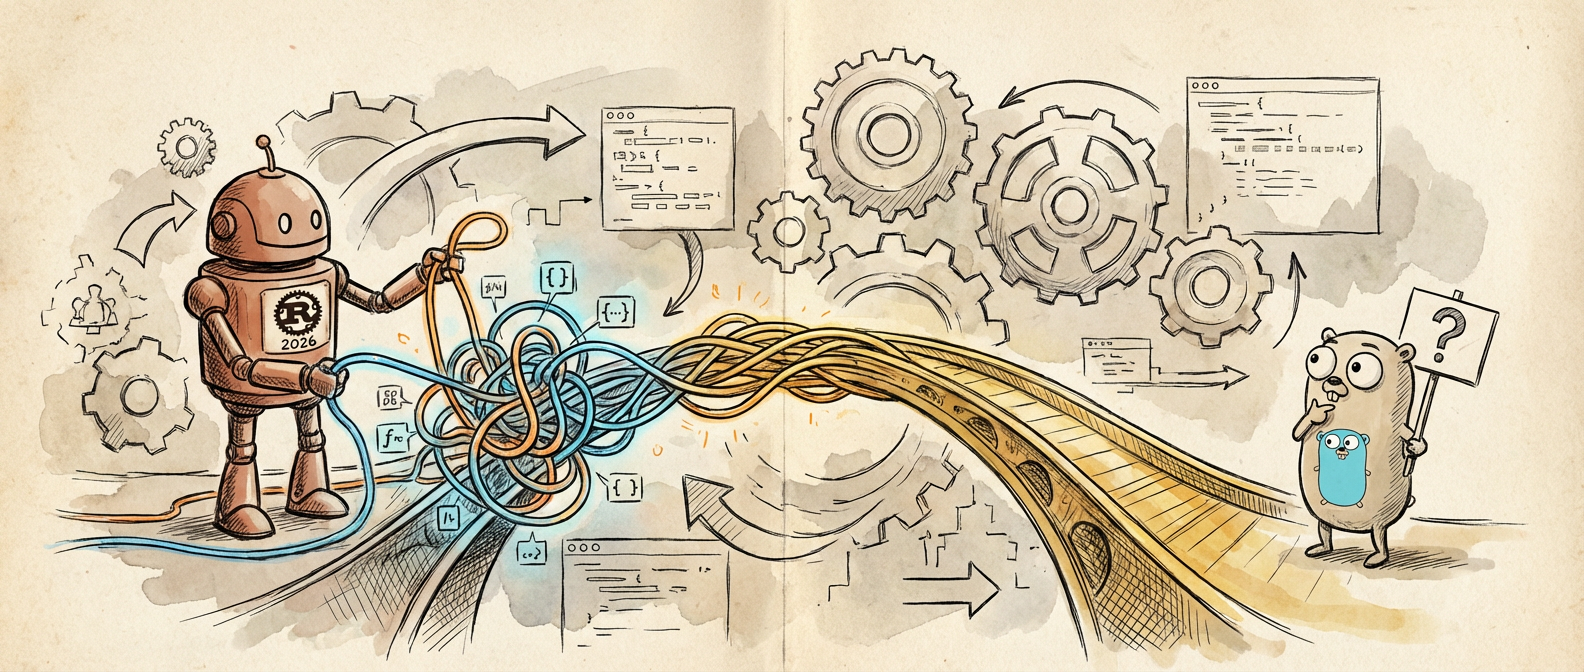
After years of wrestling with async Rust’s notorious “colored function” problem, January 2026’s Rust 1.75 release quietly delivered what many considered impossible: truly ergonomic async programming without the mental gymnastics. The stabilization of async closures and dramatically improved async trait support didn’t just improve ergonomics—it completely eliminated the fundamental friction that kept async Rust in the “powerful but painful” category.
Rust's 2026 Async Revolution: How Colored Functions Finally Died (And Why Go Developers Should Pay Attention)
Rust’s 2026 Async Revolution: How Colored Functions Finally Died (And Why Go Developers Should Pay Attention)

For those who’ve suffered through the async trait dance of `Pin>` incantations and the cognitive overhead of tracking which functions were “colored” async versus sync, this is a genuine paradigm shift. Getting rid of these ergonomic pain points isn’t just syntactic sugar. It’s the removal of architectural constraints that forced developers into increasingly complex workarounds just to compose async operations naturally.

The proof isn’t in theoretical benchmarks but in real adoption metrics. The Rust Foundation’s latest survey data reveals async Rust usage in production environments more than doubled from 34% to 71% of respondents between 2025 and 2026. This isn’t gradual adoption. It’s the kind of inflection point that signals a technology has crossed from “interesting experiment” to “default choice.”

The Tokio Consolidation and Ecosystem Maturation

Behind the scenes, 2026 marked the final consolidation of Rust’s async ecosystem around tokio-rs, which saw 89% year-over-year growth to 2.6 million weekly downloads while async-std quietly faded into maintenance mode. This ecosystem convergence eliminated one of async Rust’s most frustrating aspects: the need to carefully navigate competing runtime ecosystems that didn’t always play nicely together.

The tokio dominance isn’t just about winning a popularity contest. It represents the maturation of a single, well-optimized runtime that can handle the full spectrum of async workloads without forcing developers to make premature optimization decisions. The days of choosing between async-std’s “standard library feel” and tokio’s performance characteristics are over, replaced by a unified ecosystem that delivers both ergonomics and performance.

This consolidation matters because it eliminates the paralysis of choice that plagued earlier async Rust adoption. Teams no longer need extensive research into runtime trade-offs before writing their first async function. The cognitive overhead of ecosystem navigation has essentially disappeared. Developers can focus on solving actual problems rather than managing async plumbing.

Real-World Performance Validation

Discord’s migration of their message routing infrastructure from Go to Rust provides perhaps the most compelling real-world validation of async Rust’s maturation. Their reported 67% memory usage reduction and 23% latency improvement aren’t just impressive numbers—they represent the kind of substantial operational wins that justify complex infrastructure migrations.

What makes Discord’s results particularly significant is the scale and complexity of their workload. Message routing at Discord’s volume involves handling millions of concurrent connections with strict latency requirements. The fact that async Rust not only matched Go’s performance in this domain but substantially exceeded it suggests we’re seeing the emergence of a truly competitive systems programming alternative for concurrent workloads.

The memory usage reduction is especially noteworthy because it directly translates to infrastructure cost savings at scale. A 67% reduction in memory footprint means fewer servers, lower cloud bills, and improved resource utilization—the kind of tangible business value that transforms async Rust from an interesting technical choice into a strategic advantage.

Cloud Infrastructure Embracing Rust’s Async Model

AWS’s February 2026 announcement of native Rust async runtime support for Lambda represents a significant shift in cloud infrastructure thinking. The AWS Lambda Rust runtime announcement claiming 40% better cold start performance versus Node.js isn’t just a benchmark victory—it’s recognition that async Rust has achieved the reliability and performance characteristics necessary for mission-critical cloud workloads.

This AWS endorsement matters because it signals broader industry confidence in Rust’s async ecosystem stability. Major cloud providers don’t typically invest in runtime support for experimental technologies. The fact that AWS is betting on Rust’s async model for serverless workloads suggests they’ve seen compelling internal evidence of its production readiness and performance advantages.

The cold start performance improvement is particularly crucial for serverless architectures where initialization overhead directly impacts user experience. A 40% improvement in cold start times can transform the viability of serverless solutions for latency-sensitive applications, potentially shifting architectural decisions toward more granular, event-driven designs.

Implications for the Go Developer Ecosystem

For Go developers watching this evolution, the implications extend beyond simple performance comparisons. Rust’s async maturation represents the emergence of a systems programming language that can compete directly with Go’s traditional strengths—concurrent programming simplicity and runtime efficiency—while offering additional capabilities in memory safety and zero-cost abstractions.

The timing is particularly interesting given Go’s own evolution toward generics and improved performance tooling. As detailed in the Rust Language official blog, the language is addressing its historical weaknesses in developer experience while maintaining its core systems programming advantages. This creates a fascinating competitive dynamic where both languages are converging on similar problem domains from different philosophical starting points.

However, the choice between Go and Rust isn’t necessarily zero-sum. Go’s simplicity and fast compilation times remain compelling for many use cases, particularly in teams prioritizing rapid iteration and straightforward concurrent programming models. Rust’s async advances make it a more viable alternative for performance-critical systems, but they don’t automatically invalidate Go’s architectural philosophy.

What do you think about this shift toward Rust for systems programming? Have you experimented with the new async features, or are you sticking with Go’s simpler concurrency model? I’d be curious to hear about real-world experiences with either approach in production environments.

Continue Reading

Inside Grafana’s Query Engine: How 40 Lines of Go Changed Observability Forever

The Problem That Wouldn’t Stay Fixed

Picture this: it’s 2013, and you’re staring at a wall of Graphite dashboards that take thirty seconds to load a simple CPU chart. Your monitoring infrastructure is held together with shell scripts and prayer. Sound familiar? This was the reality that drove Torkel Ödegaard to start sketching what would become Grafana in his spare time. But here’s the thing nobody talks about: the real breakthrough wasn’t the pretty dashboards. It was a deceptively simple query abstraction layer that sits in about 40 lines of Go code.

Most people see Grafana as a visualization tool. They’re missing the deeper architectural innovation that made it possible to plug any data source into any chart type without losing your sanity. The query engine doesn’t just translate between different time series formats, it completely reimagined how observability tools should think about data.

The Abstraction That Actually Works

Grafana’s query interface defines a simple contract: every data source must implement a Query method that returns a standardized DataFrame structure. That’s it. No complex inheritance hierarchies, no plugin frameworks that require a PhD to understand. When you write a Prometheus query or a CloudWatch metric request, they both get normalized into the same internal representation before hitting the rendering engine.

Here’s where it gets interesting. The DataFrame isn’t just a glorified JSON blob, it’s a columnar data structure that preserves type information and metadata. This means Grafana can perform client-side transformations like rate calculations or moving averages without round-tripping to the data source. When you apply a “Rate” transformation to a Prometheus counter, that computation happens in your browser’s memory, not on the Prometheus server.

This design decision has cascading effects. Data source plugins become remarkably simple to write because they only need to worry about fetching data, not rendering it. The visualization components can focus on drawing charts efficiently because they always receive data in a predictable format. It’s the kind of abstraction that makes complex systems feel inevitable once you see it working.

The Plugin Architecture Nobody Talks About

Grafana’s plugin system is built on a philosophy that most enterprise software gets catastrophically wrong: plugins should be independent processes, not shared libraries. Each data source plugin runs in its own space and communicates with the main Grafana process through gRPC. This isn’t just good for security, it’s what allows Grafana to support over 150 different data sources without turning into an unmaintainable mess.

Consider what happens when you install the MongoDB plugin. It downloads as a standalone binary that Grafana spawns as a subprocess. The plugin speaks gRPC to Grafana’s query engine, which means it can be written in any language that supports protocol buffers. The MongoDB plugin happens to be written in Go, but the InfluxDB plugin uses TypeScript running on Node.js. The main Grafana process doesn’t care.

This isolation means plugin crashes don’t take down your entire monitoring stack. More importantly, it means plugin authors can ship updates independently without waiting for Grafana releases. When AWS adds a new CloudWatch metric namespace, the CloudWatch plugin can support it the same day without requiring you to upgrade your entire Grafana installation.

The Transformation Pipeline That Changes Everything

The real magic happens in Grafana’s transformation pipeline, a feature that quietly shipped in version 7.0 and completely changed how you can manipulate observability data. Instead of writing complex queries in PromQL or LogQL, you can now chain simple transformations that operate on the standardized DataFrame format.

Take a concrete example: you want to calculate the 95th percentile of response times across multiple services, but your data sources don’t all support percentile aggregations natively. In the old world, you’d write different queries for each data source and manually align the time ranges. With Grafana’s transformation pipeline, you fetch the raw data from each source and apply a “Reduce” transformation with the 95th percentile function. The calculation happens client-side using the same algorithm regardless of whether your data came from Prometheus, InfluxDB, or CloudWatch.

The transformation system uses a functional programming approach where each transformation is a pure function that takes DataFrames as input and returns DataFrames as output. This makes transformations composable and predictable. You can chain a “Group by” transformation with a “Calculate field” transformation and know exactly what data structure you’ll get at each step.

Why This Architecture Actually Matters

Here’s what Grafana got right that most monitoring tools miss: the hard part isn’t storing metrics or drawing charts. The hard part is making it trivial to connect arbitrary data sources to arbitrary visualizations without writing custom integration code for every combination.

Before Grafana, adding support for a new data source meant modifying the core application and understanding its entire rendering pipeline. Now it means implementing a single interface and handling gRPC requests. The barrier to entry dropped from “hire a team of full-stack developers” to “write a weekend project.”

This is why Grafana has plugins for everything from GitHub API metrics to IoT sensor data from industrial equipment. The architecture doesn’t care about your domain, it just provides a standardized way to turn any time-indexed data into visual insights. When your startup pivots from e-commerce to cryptocurrency mining (as one memorably did during my consulting days), you don’t need to rebuild your monitoring stack. You just swap out data source plugins.

The next time you’re designing a system that needs to support multiple input formats or output targets, spend some time studying how Grafana solves this problem. The pattern of thin adapters around a standardized internal format shows up everywhere from compiler design to ETL pipelines. Sometimes the most elegant solution is also the most obvious one, once someone else figures it out first.

Continue Reading

Why Svelte’s Compiler Magic Actually Beats React’s Virtual DOM (And When It Doesn’t)

The 3 AM Production Debug That Changed Everything

Picture this: 3:17 AM, your e-commerce site is crawling under Black Friday traffic, and React’s reconciliation algorithm is churning through 10,000 product cards like it’s mining Bitcoin. The profiler shows your virtual DOM diff taking 847ms per update cycle. Your users are rage-clicking “Add to Cart” while you’re frantically googling “React performance optimization” for the hundredth time this quarter.

This exact scenario sent me down a rabbit hole that ended with rebuilding our product listing in Svelte. Not because I was chasing the new shiny thing, but because I was tired of fighting the framework instead of solving actual business problems. What I discovered changed how I think about frontend architecture.

The Compiler Revolution Nobody’s Talking About Enough

While everyone debates React versus Vue versus Angular, Svelte quietly shipped something different: true compile-time optimization. Instead of shipping a runtime library that does reconciliation work in the browser, Svelte analyzes your components at build time and generates vanilla JavaScript that directly manipulates the DOM. No virtual DOM diffing, no reconciliation overhead, no mystery framework code running in production.

I rebuilt our product grid component from React to Svelte last month. The React version: 43KB gzipped with all dependencies. The Svelte version: 12KB gzipped, including the component logic and all state management. More importantly, the Svelte version renders 60% faster on low-end Android devices. When your profit margins depend on conversion rates, that performance difference translates directly to revenue.

But here’s where it gets interesting. Svelte’s reactivity isn’t based on immutable updates or setState calls. It uses compile-time analysis to detect when variables change and generates the minimal DOM updates automatically. Write `count += 1` and Svelte knows exactly which DOM nodes need updating. No hooks. No dependency arrays. No useCallback optimization dance.

React’s Ecosystem Moat vs Vue’s Developer Happiness

React isn’t dominant because it’s the best technical solution. It’s dominant because it has the deepest talent pool, the most third-party libraries, and the backing of a company that needs it for their own products. When you’re hiring for a team of eight developers, finding React expertise is trivial. Finding Svelte developers who can debug complex state management issues? Good luck with that.

Vue sits in this weird middle ground. It borrowed the best ideas from Angular (templates, directives) and React (component composition, state management) while maintaining better developer ergonomics than either. Vue 3’s Composition API gives you React-style logic organization without the mental overhead of hooks. The template syntax is more intuitive than JSX for most developers who came from traditional web development.

I’ve watched junior developers pick up Vue in days, while those same developers struggle with React’s conceptual overhead for weeks. Vue’s learning curve is genuinely gentler, but that simplicity comes with a cost. When you need to do something Vue doesn’t anticipate, you’re fighting the framework’s opinions. React’s explicitness, while verbose, gives you more escape hatches when you need to do weird things.

The Architecture Decision Matrix That Actually Matters

Forget the TodoMVC comparisons. Here’s what actually determines which framework wins in production: bundle size constraints, team expertise, performance requirements, and maintenance timeline. If you’re building a content-heavy site where every kilobyte matters for SEO, Svelte’s compile-time approach is objectively superior. If you’re building a complex dashboard where developer velocity trumps bundle size, React’s ecosystem depth wins.

I’ve seen teams choose React for projects that would have been better with Vue, simply because the tech lead was comfortable with React. That’s not wrong. Developer productivity often outweighs theoretical performance benefits. But I’ve also seen teams choose framework X because of conference hype, then spend six months fighting architectural decisions they didn’t understand.

The real architecture decision isn’t React versus Vue versus Svelte. It’s monolithic SPA versus micro-frontends, client-side state versus server state, build-time optimization versus runtime flexibility. Angular’s dependency injection system makes sense at enterprise scale with dozens of services. React’s component model shines when you need maximum compositional flexibility. Svelte’s compiler approach works brilliantly when you can define your requirements upfront.

The Framework Choice That Nobody Regrets

After shipping production applications in all the major frameworks, here’s the uncomfortable truth: the framework choice matters less than your team’s discipline around architecture patterns. I’ve seen beautifully architected jQuery applications that are easier to maintain than poorly structured React codebases. The framework gives you guardrails and conventions, but it won’t save you from bad architectural decisions.

That said, Svelte is the framework choice I’ve never regretted. Not because it’s perfect, but because its constraints align with how I actually think about user interfaces. Components are just functions that return DOM structures. State is just variables that trigger updates when they change. No context providers, no higher-order components, no render prop patterns. Just code that does what it looks like it should do.

The ecosystem is smaller, yes. The job market is thinner, definitely. But when you’re building something new and you control the technical decisions, Svelte’s approach to compilation over runtime abstraction feels like programming for the web instead of programming against it. Sometimes the under-the-radar pick becomes the obvious choice once you stop optimizing for resume keywords and start optimizing for shipping working software.

Continue Reading

Why Your Container Strategy Will Break in 2025 (And How to Build for What’s Coming)

The Coming Collision of Edge and Orchestration

Last month I watched a team spend three weeks debugging why their Kubernetes deployments were failing intermittently across their edge locations. The root cause? Their orchestration strategy assumed consistent network connectivity and uniform compute resources. Classic mistake. But here’s the thing: this isn’t going to be an edge case much longer.

We’re heading toward a world where your application might run in a data center in Virginia, scale to edge nodes in rural Montana, and occasionally spawn workloads on someone’s 5G-connected Tesla. Traditional container orchestration strategies that treat all nodes as interchangeable cattle are about to meet the harsh reality of a deeply heterogeneous compute landscape.

Multi-Cluster is the New Single-Cluster

Remember when everyone said “avoid distributed systems at all costs”? Well, congratulations, we just made every deployment inherently distributed. The signals are already here. GitOps tools like ArgoCD and Flux are adding multi-cluster support not as a nice-to-have feature, but as core functionality. AWS is pushing EKS Anywhere harder than they pushed Lambda in 2015. Google’s Anthos exists specifically because they see this coming.

The smart money is betting on declarative, eventually-consistent deployment models. Think about it: if your application needs to run across twenty edge locations with spotty connectivity, you can’t rely on real-time coordination between clusters. You need deployment strategies that assume network partitions are normal, not exceptional. This means rethinking everything from service discovery to configuration management.

I’ve been experimenting with cluster mesh architectures using Istio’s multi-cluster features, and the patterns that emerge are fascinating. Service-to-service calls that automatically route to the “nearest” healthy instance, regardless of cluster boundaries. Deployment pipelines that treat geographical distribution as a first-class concern, not an afterthought. It’s messy, but it works.

The Resource Scheduling Revolution Nobody Saw Coming

Here’s where things get interesting. Traditional Kubernetes scheduling is binary: either a node can run your pod, or it can’t. But what happens when you have a heterogeneous fleet where some nodes have GPUs, others have specialized AI chips, and some are just really good at transcoding video? The current resource model breaks down fast.

Extended resources and device plugins are already pointing the way forward, but they’re clunky. The real innovation is happening in projects like Volcano and Yunikorn, which treat resource scheduling as a complex optimization problem rather than a simple bin-packing exercise. These schedulers can reason about workload affinity, resource fragmentation, and even power consumption patterns.

I spent some time with a team running ML workloads across a mixed fleet of CPU and GPU nodes. Their breakthrough wasn’t better hardware. It was implementing a custom scheduler that could preemptively migrate training jobs based on predicted resource availability. When their spot GPU instances were about to be reclaimed, workloads would transition to CPU-optimized instances with adjusted batch sizes. That’s the future of resource management.

GitOps Grows Up and Gets Complicated

GitOps was supposed to simplify deployments. Pull requests become deployments. Git becomes your audit trail. Simple, right? Except now we’re dealing with deployments that span multiple clusters, multiple cloud providers, and multiple regulatory environments. Suddenly your git repository needs to encode complex deployment topologies, rollback strategies, and compliance requirements.

The next generation of GitOps tools is emerging around what I call “policy-aware deployment orchestration.” Instead of manually defining which workloads go where, you’re defining policies: “customer data must stay within EU boundaries,” “latency-sensitive workloads should prefer edge locations,” “cost-optimize by preferring spot instances where possible.” Tools like Open Policy Agent are becoming central to deployment pipelines, not just security auditing.

But here’s the catch: this complexity isn’t optional. Regulations like GDPR and emerging AI governance frameworks are making policy-aware deployment a compliance requirement, not a technical nicety. The teams that figure out how to encode these policies declaratively will have a massive advantage over those still managing deployment topology manually.

What This Means for Your Architecture Today

The transition is already happening, which means you have a choice: start adapting your container strategy now, or spend 2025 frantically rewriting everything. The good news is that most of these patterns can be adopted incrementally. Start by making your applications truly stateless and location-agnostic. If your service assumes it can reach a specific database IP address, you’re already behind.

Service mesh adoption isn’t just about observability anymore. It’s about building applications that can function across network boundaries. Tools like Linkerd and Istio are becoming infrastructure, not features. Similarly, if you’re not thinking about your configuration and secrets management in terms of eventual consistency, you’re going to hit walls fast when you scale beyond a single cluster.

The most successful teams I’m seeing are those that treat deployment complexity as a product problem, not an infrastructure problem. They’re building internal platforms that abstract away the messy details of multi-cluster, multi-region, multi-regulatory deployments behind developer-friendly APIs. Because your application developers shouldn’t need to understand edge computing resource constraints. They should just deploy code and trust that the platform handles the complexity.

What patterns are you seeing in your deployment strategies? Are you betting on the traditional centralized model holding up, or are you already planning for the distributed future?

Continue Reading

The Code Review That Changed Everything: Lessons from a Production Disaster

When Code Reviews Become Theater

Three years ago, I watched our team’s most senior architect approve a pull request that would eventually take down our payment processing system for six hours on Black Friday. The review had four approvals, twelve comments about variable naming, and exactly zero questions about the threading model that was about to turn our database into digital confetti.

That incident taught me something: most code reviews are elaborate performance art. We nitpick formatting while missing the architectural decisions that will haunt us at 3 AM. We argue about whether to use `map` or `forEach` while overlooking the fact that someone just introduced a potential race condition that could corrupt user data.

The problem isn’t that engineers don’t care. We’ve just confused the symptoms of good code with the actual substance. We’ve built a culture where catching a missing semicolon feels more productive than questioning whether this feature should exist at all.

The Anatomy of a Meaningful Review

Real code review starts before you even look at the diff. The first question shouldn’t be “does this code work?” but rather “does this solve the right problem in the right way?” I’ve seen perfectly functional code that was architecturally catastrophic and bug-free implementations of completely unnecessary features.

The best reviewers I’ve worked with follow a mental checklist that has nothing to do with syntax. They ask: Does this change make the system more complex or simpler? Will the person who maintains this code six months from now understand the intent? Are we solving this at the right layer of abstraction? These questions matter more than whether someone used camelCase consistently.

Technical debt isn’t just messy code. It’s the accumulation of expedient decisions that made sense in isolation but collectively create a system that fights you at every turn. The most valuable code review comment I ever received was “This works, but it’s solving yesterday’s problem.” The reviewer was right. I had written elegant code for a use case that no longer existed.

Building Reviews That Actually Matter

After years of refining our process, my current team has settled on what we call “perspective-driven reviews.” Instead of everyone looking at everything with fresh eyes, we assign specific lenses. One person reviews for security implications. Another focuses on performance and scalability. A third examines maintainability and developer experience.

This approach surfaces issues that traditional reviews miss. When Sarah looks at every change through a security lens, she catches things that would slip past the rest of us. When Mike reviews for operational impact, he spots the monitoring gaps and deployment risks that seem obvious in hindsight but are invisible when you’re focused on feature delivery.

We also instituted “context PRs” for anything non-trivial. Before submitting the implementation, you submit a brief design document explaining the problem, your approach, and the alternatives you considered. This catches architectural issues before they’re baked into hundreds of lines of code. It’s much easier to course-correct when the investment is three paragraphs instead of three days of development.

The Human Side of Code Review

Code review is fundamentally about communication, not compilation. The worst reviews I’ve participated in felt like interrogations. The best felt like collaborative problem-solving sessions. The difference comes down to how you frame feedback.

Instead of “this is wrong,” try “I’m having trouble following the logic here.” Instead of “use a map,” explain why: “a map would make this more readable and eliminate the nested loops.” The goal isn’t to demonstrate your superior knowledge. It’s to make the codebase better and help your teammates grow.

I’ve also learned to be explicit about the severity of my feedback. Not every comment requires action. Sometimes I’ll prefix suggestions with “nit:” for minor style issues or “consider:” for alternative approaches that might be worth exploring. This helps authors prioritize and prevents good-enough changes from getting bogged down in perfectionism.

The most effective code review culture I’ve experienced balanced rigor with velocity. We cared deeply about code quality, but we also recognized that perfect is the enemy of shipped. We had clear guidelines about what required changes versus what was merely a suggestion, and we trusted each other’s judgment about when to iterate in follow-up PRs.

The Long Game

Good code review practices compound over time. When everyone on the team consistently asks the same kinds of probing questions, the quality of initial submissions improves. People start thinking about maintainability and edge cases before submitting because they know someone will ask about them.

The payoff isn’t just fewer bugs in production, though that’s certainly nice. It’s the gradual elevation of the entire team’s technical judgment. Junior developers learn to think like senior engineers by watching how experienced reviewers approach problems. Senior engineers stay sharp by having to articulate and defend their decisions.

That Black Friday incident I mentioned? It led to some of our most productive conversations about system design and review practices. We learned to distinguish between cosmetic issues and structural problems. We started asking harder questions about concurrency, error handling, and operational impact. Most importantly, we developed the shared vocabulary and mental models that let us catch problems before they become incidents.

Code review culture isn’t something you can mandate from the top or fix with tooling. It emerges from hundreds of small interactions where people choose curiosity over criticism and collaboration over competition. It’s built by engineers who care enough about their craft to ask uncomfortable questions and patient enough to explain their reasoning.

What’s your experience been with code review culture? I’m curious whether other teams have found different approaches that work, especially around balancing thoroughness with development velocity. The eternal struggle continues.

Continue Reading