The Supply Chain Vulnerability Nobody Wants to Talk About

Your Dependencies Have Dependencies (And So Do Theirs)

I was reviewing a security audit last week when I noticed something that made me pause my coffee mid-sip. A React application with 47 direct dependencies had somehow accumulated 2,847 transitive dependencies. That’s a 60-to-1 multiplier. Each one of those packages is a potential attack vector, a maintenance burden, and a delightful little time bomb that could detonate when you least expect it.
The Supply Chain Vulnerability Nobody Wants to Talk About

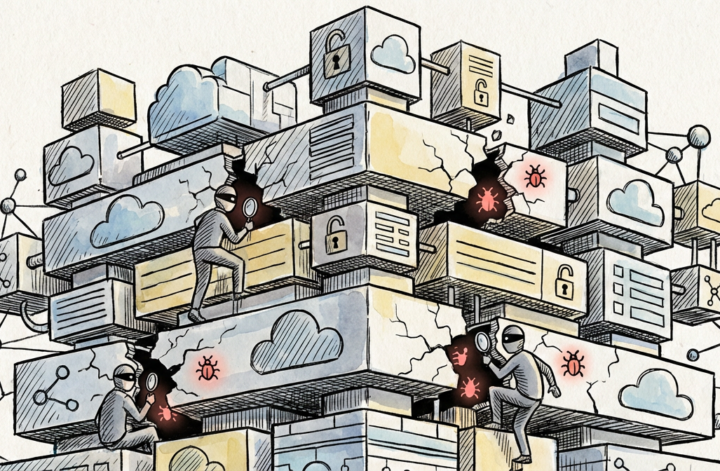
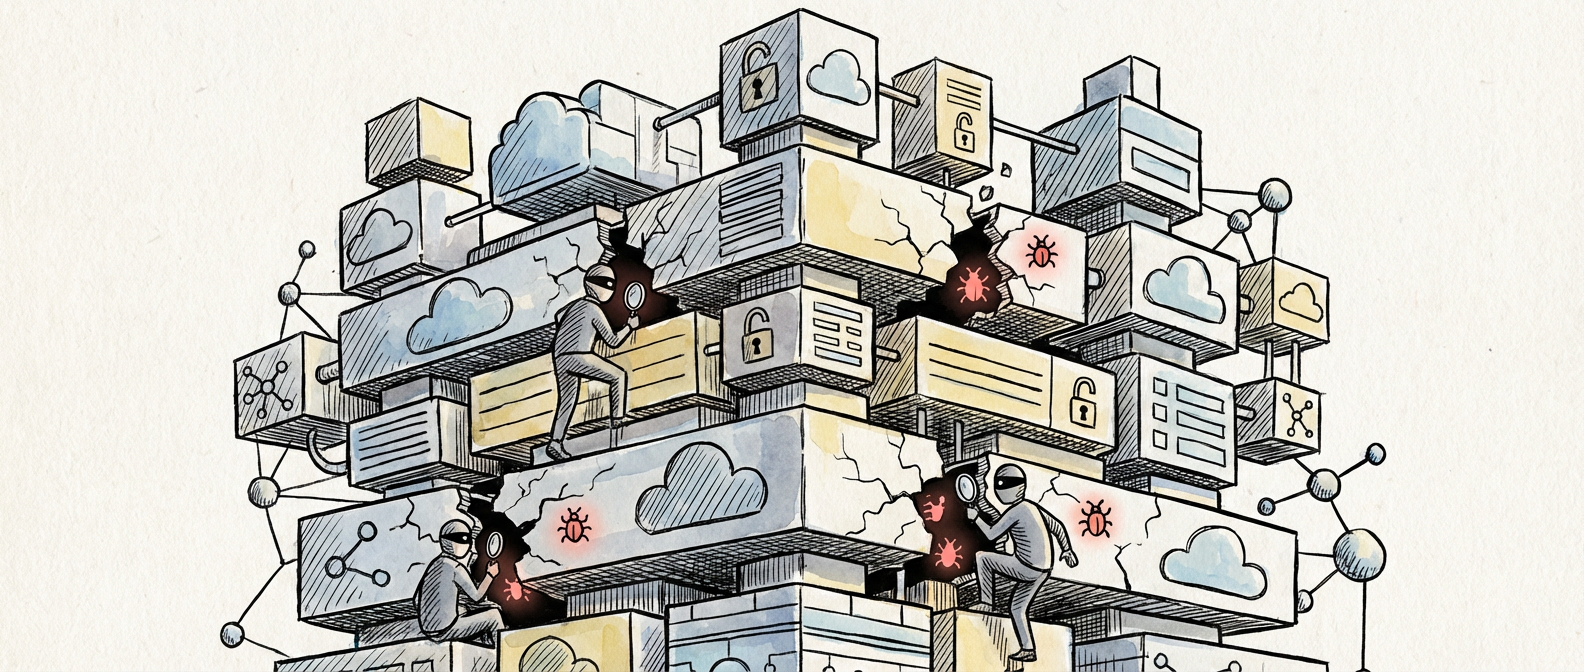
The modern JavaScript ecosystem has embraced the Unix philosophy with religious fervor. Do one thing well, they say. Compose solutions from small, focused modules. It sounds elegant until you realize that displaying “Hello World” now requires downloading half the internet. The left-pad incident wasn’t an anomaly. It was a preview of what happens when we build cathedrals on foundations made of Jenga blocks.

What troubles me isn’t the dependency count itself. It’s the collective shrug we’ve given to the security implications. We’ve normalized the idea that our applications should depend on thousands of packages maintained by strangers, updated constantly, and governed by nothing more substantial than semantic versioning and good intentions. The attack surface area has grown exponentially, but our security practices still assume we’re dealing with monolithic applications written by people in the same building.

Illustration for The Supply Chain Vulnerability Nobody Wants to Talk About

Container Images Are Not Security Boundaries

Docker revolutionized deployment, but it also gave us the world’s most sophisticated method of shipping vulnerabilities directly to production. I’ve seen container images that started as 50MB Alpine Linux bases and somehow ballooned to 2GB monsters containing entire Linux distributions, multiple language runtimes, and enough outdated libraries to make a penetration tester weep with joy.

Here’s the fundamental misconception: treating containers as security isolation mechanisms. They’re not. They’re process isolation mechanisms with a thin layer of resource controls. The kernel is still shared. The network stack is still accessible. That shiny container orchestration platform you’re running? It has root access to every node, and if it gets compromised, your “isolated” workloads are about as secure as files in a shared folder.

Multi-stage builds were supposed to solve the bloat problem, but most teams use them wrong. They’ll copy their entire application source code into the build stage, install dependencies with package managers that cache everything, then selectively copy artifacts to the runtime stage while leaving behind manifests that still reference the vulnerable packages they “removed.” The result is smaller images with identical attack surfaces and worse debugging capabilities.

The solution isn’t more complex tooling. It’s going back to first principles. Minimal base images. Explicit dependency management. Regular vulnerability scanning that actually fails builds instead of generating reports that nobody reads. And please, for the love of all that is debuggable, stop running everything as root inside containers just because you can.

API Security Theater and the JWT Cargo Cult

JSON Web Tokens have become the hammer that makes every authentication problem look like a nail. Teams implement JWT-based authentication with the same enthusiasm they once reserved for microservices, usually with about the same level of understanding of the underlying complexity. The result is an ecosystem full of APIs that are simultaneously over-engineered and fundamentally insecure.

The most common mistake is treating JWTs as magic security tokens instead of what they actually are: a standardized way to encode claims that can be verified without a database lookup. Teams store sensitive data in JWT payloads, forget that the signature only prevents tampering (not reading), and implement custom verification logic that bypasses critical security checks. I’ve seen production systems that validate JWT signatures but ignore expiration times, accept tokens signed with “none” algorithms, and trust client-provided key identifiers without verification.

Rate limiting deserves special mention as the poster child for security theater. Most implementations are laughably easy to bypass. IP-based rate limiting gets defeated by proxy rotation. User-based rate limiting assumes you can identify users before they authenticate. API key-based limiting creates a single point of failure. The sophisticated attackers aren’t brute-forcing your login endpoints. They’re exploiting the business logic flaws in your password reset flows, account creation processes, and state management.

Real API security requires understanding your threat model, not copying patterns from blog posts. Authentication should happen once and be cached appropriately. Authorization should be centralized and consistently applied. Input validation should happen at the boundary, not scattered throughout your codebase. And for the record, CORS is not a security feature. It’s a browser convenience that does nothing to protect your API from server-side attacks.

The Infrastructure as Code Blindspot

Infrastructure as Code promised to bring software engineering practices to operations. What we got instead was YAML files with root-level privileges and the operational complexity of distributed systems applied to what used to be relatively simple deployment scripts. Terraform configurations have become multi-thousand-line monstrosities that nobody fully understands, managed by CI/CD pipelines with administrative access to cloud accounts worth millions of dollars.

The security implications are staggering. Cloud credentials with broad permissions get embedded in environment variables, stored in version control, and passed through build systems that log everything. State files containing sensitive configuration data get stored in S3 buckets with public read access. Terraform providers auto-approve resource changes that could expose entire network segments to the internet.

The abstraction layers haven’t helped. Kubernetes operators that manage infrastructure resources create a meta-infrastructure problem where your infrastructure definition depends on cluster state, which depends on container images, which depend on base images with their own vulnerabilities. When something goes wrong (and something always goes wrong), the debugging process requires understanding multiple abstraction layers, each with their own failure modes and security implications.

Cloud-native security tools promise to solve these problems with more automation, more scanning, and more alerts. But automation without understanding is just faster ways to make mistakes at scale. The real solution is boring: principle of least privilege, regular credential rotation, comprehensive audit logging, and humans who understand what their infrastructure actually does instead of treating it as a black box that occasionally needs YAML adjustments.

Building Systems That Fail Securely

Security vulnerabilities aren’t bugs. They’re design failures. They happen when systems behave in ways that benefit attackers instead of failing safely. The path forward isn’t more security tools or frameworks. It’s building systems with security as a fundamental design constraint, not an afterthought to be bolted on later.

This means designing APIs that fail closed instead of open. It means choosing boring, well-understood technologies over exciting new frameworks that haven’t been battle-tested. It means accepting that security often conflicts with convenience and choosing security anyway. Most importantly, it means recognizing that every dependency, every abstraction layer, and every piece of infrastructure increases complexity in ways that tools can’t automatically manage.

I’ve spent enough time debugging production incidents to know that the systems that survive are the ones designed by people who assume everything will eventually break. What specific approaches have worked (or failed spectacularly) in your experience? The comment section exists for a reason, and I’m particularly interested in hearing about the subtle vulnerabilities that only emerge under production load.


Continue Reading

How I Accidentally Built a CI/CD Pipeline That Actually Works (And Why Most Don’t)

The 3 AM Wake-Up Call That Changed Everything

Picture this: It’s 3:17 AM on a Tuesday, and my phone is buzzing with the kind of persistence that means someone, somewhere, has broken something important. The deployment we pushed at 5 PM has decided to take a scenic route through every possible failure mode, and our “simple” rollback process is about as simple as explaining quantum mechanics to a golden retriever.

This was two years ago, back when our team was running what I generously called a “deployment strategy” but was really just a collection of shell scripts held together with hope and increasingly creative profanity. We had Jenkins jobs that worked most of the time, manual deployment steps that “everyone knew” but were documented nowhere, and a rollback process that required three different people to be online simultaneously.

That night, as I sat in my kitchen watching our error rates climb while frantically trying to remember which database migration we needed to reverse, I made a decision. Not the dramatic kind you see in movies, but the exhausted kind you make when you realize that smart people shouldn’t have to solve the same problem repeatedly at ungodly hours.

The Elegant Solution Nobody Asked For

Here’s the thing about building developer tooling: the best solutions usually start as personal vendettas against tedium. I didn’t set out to revolutionize our CI/CD pipeline. I just wanted to never again explain to a product manager why a “simple config change” had taken down the entire platform for forty-seven minutes.

I started small, which is the only way to start when you’re dealing with systems that are already on fire. Instead of trying to replace our entire deployment infrastructure, I built a simple validation layer that would catch the obvious problems before they became 3 AM problems. A script that would run our test suite, check database migrations, validate configuration files, and most importantly, verify that our rollback process actually worked.

The breakthrough came when I realized that most CI/CD failures aren’t technical problems, they’re communication problems. Our deployments failed not because the code was broken, but because the person deploying didn’t know about the database change, or the configuration update, or the fact that Sarah had modified the nginx config yesterday and forgot to mention it in the team chat.

So I built what I called the “Obvious State Machine.” Every deployment became a series of explicit, visible steps where each step had to pass before the next could begin. No more “it works on my machine” because every environment was validated in sequence. No more surprise dependencies because the system would tell you exactly what was different between staging and production.

Why Most CI/CD Pipelines Are Performance Theater

After implementing our solution and watching it prevent approximately fourteen potential disasters in the first month, I started paying attention to how other teams approached the same problem. The pattern I noticed was depressing: most CI/CD pipelines are elaborate performances designed to make managers feel good about “following best practices” while doing almost nothing to actually improve reliability.

You know the type. Thirty-seven different checks that all pass green, giving everyone a false sense of security right up until the deployment explodes because nobody thought to verify that the new environment variables were actually set in production. Tests that cover 90% of the codebase but somehow miss the one function that handles payment processing. Sophisticated monitoring that can tell you the exact nanosecond everything went wrong but provides no actionable information about how to fix it.

The problem is that most teams build their deployment pipeline around their technology stack instead of around their failure modes. They ask “how do we deploy this React app?” instead of “what are all the ways this deployment could ruin my weekend?” It’s the difference between building a system that works and building a system that fails gracefully, and that difference is measured in hours of sleep.

Real reliability comes from acknowledging that deployments will go wrong and building systems that make the problems obvious and the solutions straightforward. It means spending more time thinking about rollbacks than rollouts, more energy on monitoring than metrics, and more effort on making the simple things simple rather than making the complex things possible.

The Three Rules That Actually Matter

After two years of running this system and watching it evolve through various team changes, acquisitions, and the occasional architectural pivot, I’ve narrowed the approach down to three rules that seem to matter more than any specific technology choice.

First: every deployment step must be idempotent and reversible. This sounds obvious until you realize how many deployment processes include steps like “manually update the load balancer configuration” or “run this migration script (but only once).” If you can’t run your deployment process twice in a row and get the same result, you don’t have a deployment process, you have a ritual.

Second: the pipeline must fail fast and fail obviously. I’ve seen too many systems that will happily deploy broken code as long as it compiles, or that hide critical failures in the middle of hundreds of lines of log output. When something goes wrong, the system should stop immediately and tell you exactly what’s broken, not continue optimistically and hope for the best.

Third: every failure must improve the system. This is the rule that transforms your CI/CD pipeline from a static checklist into a learning organism. When a deployment fails, you don’t just fix the immediate problem, you add a check to prevent that category of failure from ever happening again. Over time, your deployment process becomes accumulated wisdom about all the ways things can go wrong in your specific environment.

What Two Years of Production Use Actually Taught Me

The system has been running in production for two years now, and it’s prevented more disasters than I can count. But the real surprise wasn’t the reduction in deployment failures, it was how it changed the way our team thinks about building software.

When you know that every code change will go through a comprehensive validation process, you start writing code differently. You think about edge cases earlier. You document your assumptions. You write tests that actually test the things that break in production, not just the things that are easy to test. The deployment pipeline becomes a forcing function for better engineering practices.

The system has also taught me that the best developer tooling is almost invisible. Our new team members don’t think about the deployment process, they just push code and trust that if something is wrong, they’ll know about it immediately and have clear guidance on how to fix it. They’re not impressed by the sophistication of our pipeline; they’re relieved by its predictability.

Most importantly, I haven’t been woken up by a deployment failure in eighteen months. Not because we never have problems, but because when we do have problems, they’re caught early and fixed during business hours by people who are alert and thinking clearly.

If you’re dealing with your own 3 AM deployment disasters, I’d love to hear about your approach to solving them. The specific technologies matter less than the principles, and every production environment has its own unique ways of teaching you humility.

Continue Reading

The Great Architecture Debate: When to Break Up Your Monolith (And When Not To)

The Decision That Keeps CTOs Awake at Night

You know that moment when someone in a meeting drops the word “microservices” and suddenly everyone’s nodding like they understand exactly what that means for your three-person engineering team? I’ve been in enough of these conversations to know that behind all the confident head-bobbing lies a fundamental question: should we stick with our monolith or embrace the distributed future?

The Great Architecture Debate: When to Break Up Your Monolith (And When Not To)

Here’s the uncomfortable truth that no conference talk wants to admit. Most startups rushing toward microservices are solving problems they don’t actually have yet. Meanwhile, companies clinging to monoliths often ignore real scalability pain points until their deployment process takes longer than a cross-country flight. The real skill isn’t picking the “right” architecture. It’s knowing when to make the transition.

After debugging both architectures in production at ungodly hours, I can tell you that each comes with its own special brand of 3 AM wake-up calls. The difference is whether you’re hunting down a single catastrophic bug or playing distributed systems detective across twelve different services. Both will test your caffeine tolerance, just in different ways.

Starting Simple: Your Monolith Foundation

Every successful distributed system I’ve seen started life as a well-structured monolith. This isn’t some architectural consolation prize. It’s the training ground where you learn your domain boundaries, understand your data relationships, and figure out what your application actually needs to do before you complicate everything with network calls.

When you’re building your first version, embrace the monolith with intention. Structure it like you’re planning for the future, even if that future involves breaking it apart. Use clear module boundaries, separate your business logic from your framework code, and resist the urge to let your database models leak into every corner of your application. Your future self, the one who has to extract services from this codebase, will thank you for thinking ahead.

The beauty of a monolith isn’t just its simplicity. It’s the feedback loop speed. You can refactor across what will eventually become service boundaries without worrying about API versioning. You can experiment with data models without orchestrating schema migrations across multiple databases. When you’re still figuring out what you’re building, this flexibility is worth more than any theoretical scalability benefits.

Don’t let anyone shame you for starting here. Netflix didn’t begin with hundreds of microservices. They evolved into them when the monolith couldn’t support their growth. Amazon’s service-oriented architecture emerged from the problems they hit scaling their monolith. Your architecture should solve the problems you have today, not the ones you might have if you become the next unicorn.

Recognizing the Tipping Point

The transition from monolith to microservices isn’t triggered by team size or user count, though both matter. It’s triggered by friction. When deploying a small change requires coordination across multiple teams, you’ve hit an organizational boundary problem. When your test suite takes forty minutes to run because everything is coupled to everything else, you’ve hit a technical boundary problem. When different parts of your application have completely different scalability requirements, you’ve hit a resource boundary problem.

Here’s what the tipping point actually looks like in practice. Your user authentication service needs to handle thousands of requests per second while your monthly reporting system runs heavy queries once a day. Your payment processing code requires extensive audit logs and compliance measures, while your recommendation engine benefits from rapid experimentation cycles. Your mobile API needs sub-100ms response times, while your batch processing jobs can take hours to complete.

The clearest signal comes from your deployment pain. When a bug fix in your user profile code blocks the release of your new search feature for a week, you’re not dealing with a technical problem. You’re dealing with an organizational one. Microservices can solve this by creating deployment independence, but only if you’ve properly identified the service boundaries.

Watch for the Conway’s Law signals too. If your engineering teams naturally organize around different parts of the codebase and rarely need to coordinate on features, those organizational boundaries probably map well to service boundaries. The architecture should follow the team structure, not fight against it.

The Microservices Reality Check

Microservices solve real problems, but they create new ones that your monolith never had to worry about. Network partitions will happen, usually during the worst possible moments. Services will become temporarily unavailable, and your application needs to gracefully handle these failures. Data consistency across service boundaries requires careful thought about transaction boundaries and eventual consistency patterns.

The operational complexity multiplies quickly. Instead of monitoring one application, you’re monitoring dozens. Instead of one deployment pipeline, you have dozens. Instead of debugging a single stack trace, you’re correlating logs and traces across multiple services to understand what went wrong. Your monitoring, logging, and debugging tools need to evolve to handle this complexity, or you’ll spend more time fighting your infrastructure than building features.

Testing becomes completely different. Integration tests that used to run against a single application now need to coordinate multiple services. You’ll need strategies for testing service interactions, handling service dependencies in your test environment, and ensuring that changes in one service don’t break others. Some teams solve this with contract testing, others with extensive integration test suites, but all solutions require more sophistication than testing a monolith.

The performance characteristics change too. What used to be an in-process method call is now a network request with all the latency and failure modes that entails. You’ll need to think carefully about service granularity. Too fine-grained and you’ll death-by-a-thousand-cuts your performance with network overhead. Too coarse-grained and you’ve just built a distributed monolith with all the complexity and none of the benefits.

Building Your First Service Extraction

When you do decide to extract your first service, start with something that has clear boundaries and minimal dependencies. User authentication, notification sending, or file processing often make good candidates. These services typically have well-defined interfaces, limited data relationships with the rest of your application, and can be developed and deployed independently without affecting core business logic.

Before you write a single line of service code, nail down the data strategy. Decide whether the new service gets its own database or shares the existing one. Sharing is simpler initially but creates coupling that defeats the purpose of service extraction. Separate databases mean you need strategies for handling data that spans both services, but they enable true independence.

Design your service interface before you implement it. Start with the API contract and think through error cases, versioning strategy, and backward compatibility. A well-designed interface will outlive several implementations, but a poorly designed one will haunt you through every future change. Consider how you’ll handle service discovery, load balancing, and health checks from day one.

Plan your migration strategy carefully. Running both the monolith and service implementations in parallel lets you gradually shift traffic and validate the new service’s behavior. Feature flags can help you route specific users or use cases to the new service while keeping fallback options available. Monitor everything during the transition and be prepared to roll back if something goes wrong.

Remember that extracting your first service is as much about building organizational muscle as it is about solving technical problems. You’re establishing patterns for service communication, deployment automation, monitoring, and incident response that will scale to dozens of services. Invest in getting these foundations right, even if it feels like overkill for a single service extraction.

The journey from monolith to microservices isn’t a one-way trip or a binary choice. It’s an evolution that should match your team’s growth, your application’s needs, and your operational maturity. What architecture challenges are you wrestling with right now? I’d love to hear about your experiences in the comments, especially the surprising problems you didn’t see coming.

Continue Reading

Database Performance: The Fundamentals That Actually Matter

Why Your Database Is Probably Fine (But Let’s Make It Better)

After fifteen years of watching developers panic about database performance, I’ve learned something counterintuitive: most databases perform adequately for most workloads. The real problems usually stem from a few specific, fixable issues rather than some mystical need for advanced tuning wizardry. Your application probably won’t benefit from exotic partitioning schemes or custom storage engines. What it needs are the fundamentals, applied correctly.

Database Performance: The Fundamentals That Actually Matter

Here’s the thing about database optimization: 80% of performance gains come from understanding three core concepts: indexing strategy, query patterns, and connection management. Master these, and you’ll solve the vast majority of performance issues you’ll encounter in your career. Everything else is just interesting conversation at tech meetups.

I’ve debugged enough 3 AM production incidents to know that exotic solutions rarely save the day. The hero is almost always a missing index or a poorly written query that someone “optimized” by adding seventeen joins. Let’s start with what actually moves the needle.

Illustration for Database Performance: The Fundamentals That Actually Matter

Indexing: Your Database’s Table of Contents

Think of database indexes like the index in a technical book. Without it, finding specific information requires reading every page sequentially. With a good index, you jump directly to the relevant sections. This comparison works surprisingly well: a missing index forces your database to scan entire tables, while a well-designed index delivers results in milliseconds.

Start with your most frequently executed queries. Run them through your database’s query analyzer and look for table scans. Any query that examines more than a few thousand rows without an index needs attention. Create indexes on columns used in WHERE clauses, JOIN conditions, and ORDER BY statements. This covers 90% of indexing needs for most applications.

Here’s where beginners often stumble: they either create no indexes or create too many. Both approaches hurt performance. Indexes speed up reads but slow down writes, because every INSERT, UPDATE, or DELETE must maintain index consistency. A table with dozens of indexes becomes a write bottleneck. Aim for the minimum set of indexes that cover your critical queries.

Composite indexes deserve special attention because they’re frequently misunderstood. An index on (lastname, firstname, email) works excellently for queries filtering on lastname alone or lastname plus firstname. But it’s useless for queries filtering only on email. Index column order matters significantly, and getting it right requires understanding your actual query patterns rather than guessing.

Query Patterns That Don’t Hate Your Database

Most performance problems hide in innocent-looking SQL that does terrible things under load. The classic example is the N+1 query pattern, where you fetch a list of records then loop through them, making additional database calls for each item. This turns what should be two queries into hundreds. Your database connection pool gets exhausted, response times spike, and users start complaining.

The solution is straightforward: batch your queries. Use JOINs to get related data in a single round trip, or collect all the IDs you need and query for them in one WHERE IN statement. Yes, this sometimes means getting slightly more data than you immediately need. That’s fine. Network round trips are expensive; a little extra data transfer usually isn’t.

Pagination presents another common trap. Using OFFSET for large result sets creates performance problems that grow linearly with page number. Page 1 is fast, page 100 is slow, page 1000 is unusable. Cursor-based pagination using WHERE clauses on indexed columns maintains consistent performance regardless of position in the result set. It requires slightly more complex application logic but scales beautifully.

Pay attention to implicit type conversions in your WHERE clauses. Comparing a string column to a numeric value forces the database to convert every row’s value before comparison, making indexes useless. These subtle mistakes often slip through code review because the queries work correctly, just slowly.

Connection Management: The Unsung Hero

Database connections are expensive resources that many applications treat carelessly. Creating a new connection involves network handshakes, authentication, and session initialization. Do this for every query, and your database spends more time managing connections than processing data. Connection pooling solves this by maintaining a set of persistent connections that your application reuses.

Configure your connection pool thoughtfully. Too few connections create bottlenecks under load. Too many connections overwhelm your database server, which has finite resources for managing client sessions. Start with a pool size equal to your number of CPU cores, then adjust based on actual usage patterns. Most applications need fewer connections than developers initially think.

Connection timeouts deserve careful consideration. Set them long enough to handle your slowest legitimate queries but short enough to release resources from genuinely stuck operations. I’ve seen production systems brought down by a single runaway query that held connections indefinitely, because the timeout was set to an optimistic eternity.

Transaction scope is equally important but frequently overlooked. Keep transactions as short as possible. Long-running transactions hold locks that block other operations, creating cascading performance problems. If you need to perform complex operations involving multiple queries, consider breaking them into smaller transactions or using read-committed isolation levels when strict consistency isn’t required.

Monitoring: Know What’s Actually Happening

You can’t optimize what you don’t measure, and most applications run blind regarding database performance. Start with basic metrics: query execution time, connection pool utilization, and slow query logs. These provide clear signals about where problems exist and whether your optimizations actually help.

Most database systems include built-in monitoring tools that reveal query patterns and performance bottlenecks. PostgreSQL’s pg_stat_statements extension tracks query execution statistics across your entire application. MySQL’s performance schema provides similar insights. Use these tools to identify your most frequently executed and slowest queries. Optimize based on data, not assumptions.

Set up alerts for connection pool exhaustion and slow query thresholds. You want to know about performance problems before users complain. A query that suddenly takes ten times longer than usual indicates either a missing index after schema changes or a shift in data distribution that affects query planning.

Remember that database performance optimization is an iterative process. Apply one change at a time, measure the results, then decide on the next step. This methodical approach helps you understand which optimizations actually matter for your specific workload and avoid the common trap of premature optimization based on theoretical performance concerns.

These fundamentals will handle the majority of database performance challenges you’ll encounter. Once you’ve mastered indexing, query optimization, connection management, and monitoring, you’ll have the foundation needed to tackle more advanced topics with confidence. What database performance challenges are you currently facing in your projects?

Continue Reading

The Core Web Vitals Evolution: Lessons from Five Years in the Performance Trenches

When Google Changed the Game Forever

I remember the day in May 2021 when Google officially announced that Core Web Vitals would become ranking signals in their search algorithm. The collective intake of breath from the web development community was audible across every Slack channel and conference room I frequented. What had been a nice-to-have performance metric suddenly became a business-critical imperative that could make or break organic search visibility.

The Core Web Vitals Evolution: Lessons from Five Years in the Performance Trenches

Five years later, things look completely different. The initial panic has given way to better tools, smarter approaches, and a much clearer picture of what actually works. But getting here hasn’t been smooth sailing.

Those early days were chaos, honestly. Teams that had been optimizing for traditional performance metrics like page load time suddenly found themselves scrambling to understand Largest Contentful Paint, First Input Delay, and Cumulative Layout Shift. The learning curve was brutal, and nobody wanted to be the team that lost rankings because they couldn’t figure out these new metrics fast enough.

Illustration for The Core Web Vitals Evolution: Lessons from Five Years in the Performance Trenches

The Baseline Has Shifted Dramatically

What we considered good performance in 2021 barely cuts it today. Google’s integration of Core Web Vitals into their ranking algorithm created this relentless competition where everyone keeps raising the bar. A Largest Contentful Paint under 2.5 seconds used to be something you’d brag about. Now it’s just the minimum if you want to stay competitive in search rankings.

This shift reflects two things: much better tooling and the fact that performance optimization has gone mainstream. Teams that initially struggled to break the 4-second barrier are now routinely hitting sub-2-second LCP times. Performance knowledge spread quickly, infrastructure got cheaper and more accessible, and suddenly everyone had to level up.

Google’s algorithm isn’t the only pressure point either. Users themselves have gotten more impatient. The data shows people abandon sites faster than they did five years ago, and the connection between Core Web Vitals scores and actual business metrics like conversion rates is impossible to ignore. Performance stopped being just a technical nice-to-have and became a direct line to revenue.

The Metric Evolution and Infrastructure Revolution

March 2024 was a big moment when Interaction to Next Paint replaced First Input Delay as the official responsiveness metric. Having worked with both, I can tell you INP gives you a much better picture of what users actually experience. FID only looked at that first click or tap, but INP captures the entire user session. It reveals performance problems that were completely invisible before.

The infrastructure world got turned upside down too. Edge computing platforms like Cloudflare Workers and Vercel’s edge functions changed everything about Time to First Byte optimization. Complex CDN setups that used to take weeks to configure? You can now achieve the same results with a few lines of code deployed globally in seconds.

This democratization is huge. Startups can now get the kind of global response times that used to be exclusive to companies with massive infrastructure budgets. The playing field leveled out, which just made the competition even more intense.

Format Wars and Bundle Battles

Next-generation image formats have been game-changers for Core Web Vitals. AVIF adoption picked up steam fast, cutting file sizes by up to 50 percent compared to old-school JPEG files. This isn’t just theoretical optimization, it translates directly to faster LCP times and better mobile experiences where every byte matters.

But here’s the frustrating part: while we’ve gotten really good at optimizing images, JavaScript bundle bloat is still killing sites left and right. I’ve audited hundreds of sites over these five years, and the pattern never changes. Teams get excited about framework features, throw in dependencies without thinking about performance, and slowly undo all their optimization work.

It’s honestly maddening. We’ve made incredible progress on images, server response times, and CSS delivery. Meanwhile, teams keep shipping heavier and heavier JavaScript bundles. Modern frameworks make it so easy to build complex apps, but they also make it easy to accidentally ship performance-destroying code.

The good news is we’re finally getting tools that focus specifically on JavaScript’s performance impact. Teams can now see exactly which dependencies are hurting their Core Web Vitals scores, which makes it easier to make smart decisions about what belongs in production builds.

The Road Ahead and Continuous Learning

Looking at the rest of 2026, AI-powered optimization tools are picking up serious momentum. Platforms are starting to automatically optimize images, preload critical resources, and even refactor code for better performance. A lot of the manual optimization work that ate up our time in the early Core Web Vitals days is becoming automated.

The core challenge hasn’t changed though: building feature-rich applications without sacrificing performance. Every new capability creates potential trade-offs. The teams that nail this are the ones that think about performance from the very beginning, not as an afterthought when the site is already slow.

We have incredible tools now. Resources like web.dev performance offer comprehensive guidance, and PageSpeed Insights gives you real-world performance data that actually reflects user experience. But the human element still matters most. Knowing which optimizations will make the biggest difference requires experience, good instincts, and really understanding your users and technical constraints.

These five years of Core Web Vitals evolution taught me that performance optimization never ends. It’s not a project you finish, it’s an ongoing practice. Share your own performance war stories in the comments, or reach out if you’re dealing with Core Web Vitals challenges that could use some collective brainstorming.

Continue Reading